Areas of potential focus for SSMC include the following:
- Incident management/emergency vehicle management
- Freight mobility/commercial vehicles
- En-route driver information
- Disaster response and evacuation
- Archived “big data”
- Environmental/eco-friendly applications
SSMC Expertise
The UT Consortium members are nationally recognized experts in intelligent transportation systems. The team members have a combination of in-depth familiarity with various areas related to ITS deployment and evaluation. Additionally, they have expertise in the following:
- proof-of-concept
- incident management
- work zone management
- multi-modal transportation systems
- advanced traveler information systems
- big data modeling and simulation
- energy/emissions
- embedded systems
- wireless sensor networks
- software/apps, algorithms, computing (cloud), and cyber-security
Recent Activities
Below are some of the recent activities of the researchers involved with SSMC:
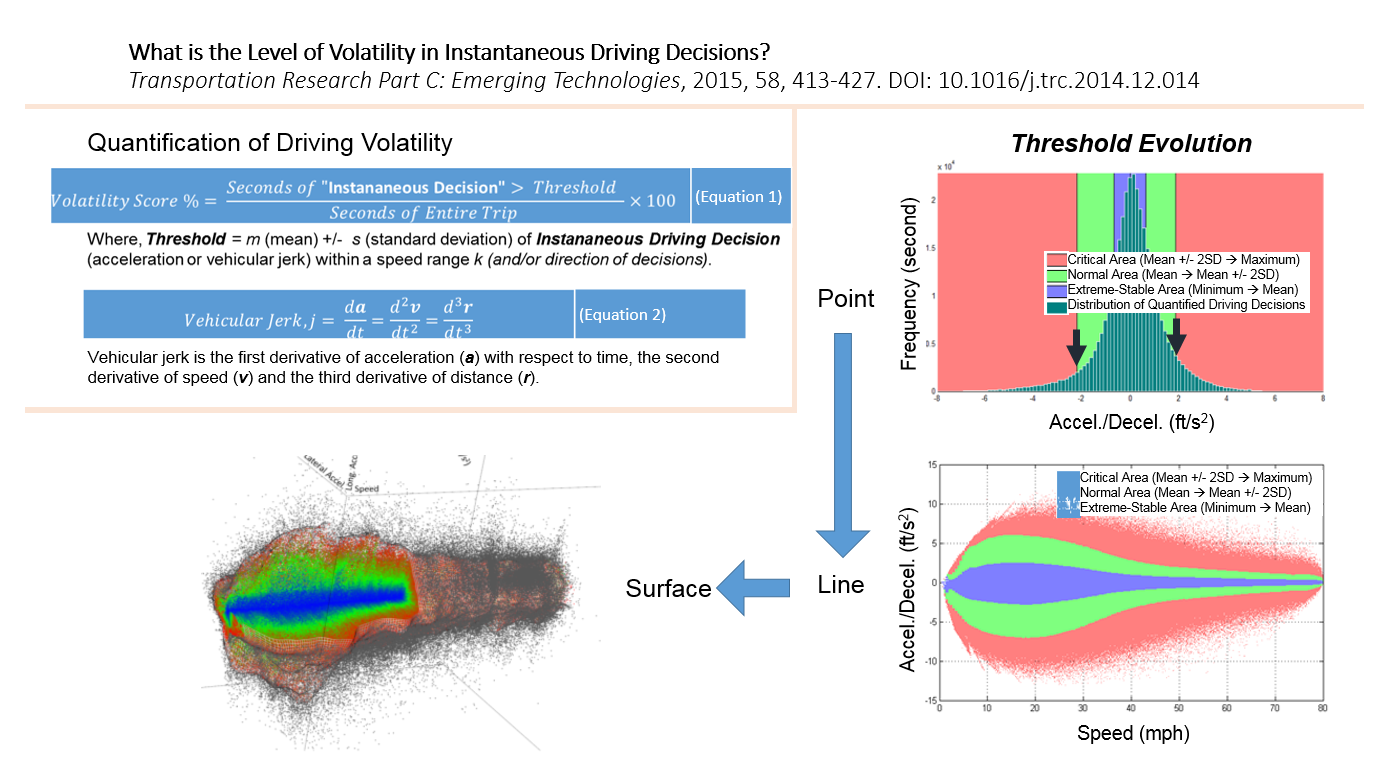
Driving Styles
Driving styles can be broadly characterized as calm or volatile, with significant implications for traffic safety, energy consumption, and emissions. How to quantify the extent of calm or volatile driving and explore its correlates is a key research question investigated in the study. This study contributes by leveraging a large-scale behavioral database to analyze short-term driving decisions and develop a new driver volatility index to measure the extent of variations in driving. The index captures variation in driving behavior constrained by the performance of the vehicle from a decision-making perspective. Specifically, instantaneous driving decisions include maintaining speed, accelerating, decelerating, maintaining acceleration/deceleration, or jerks to vehicle, i.e., the decision to change marginal rate of acceleration or deceleration. A fundamental understanding of instantaneous driving behavior is developed by categorizing vehicular jerk reversals (acceleration followed by deceleration), jerk enhancements (increasing accelerations or decelerations), and jerk mitigations (decreasing accelerations or decelerations). Volatility in driving decisions, captured by jerky movements, is quantified using data collected in Atlanta, GA, during 2011. The database contains 51,370 trips and their associated second-by-second speed data, totaling 36 million seconds. Rigorous statistical models explore correlates of volatility that include socioeconomic variables, travel context variables, and vehicle types. The study contributes by proposing a framework that is based on defining instantaneous driving decisions in a quantifiable way using big data generated by in-vehicle GPS devices and behavioral surveys.
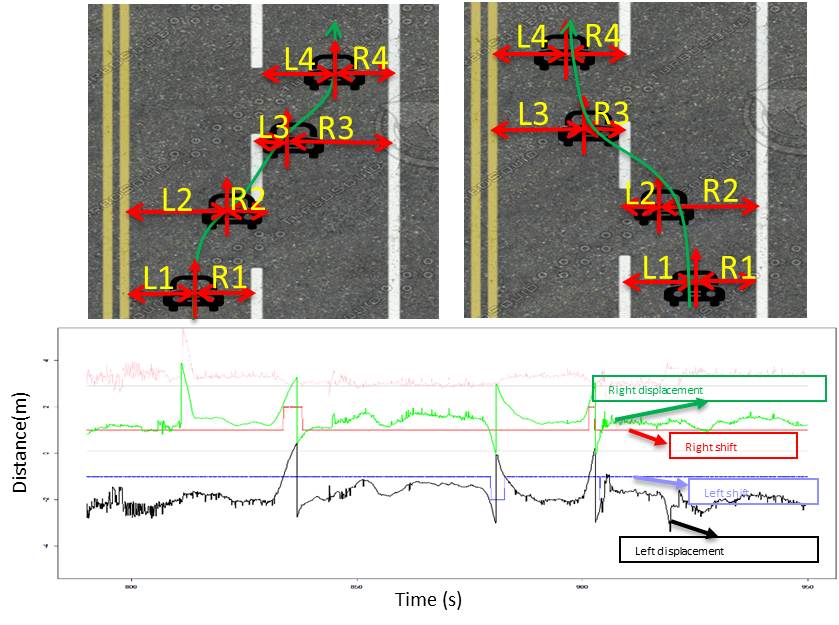
Lane Change Behaviors
Lane change behaviors have been suspected as a critical factor that can affect free traffic flow. Specially, lane change behaviors can occur at relatively high speed or without a turn signal, which may potentially lead to a crash event. With advanced wireless communication technology under connected vehicle environment, vehicles are able to communicate or exchange sub-second (10 Hz) data with each other (vehicle-to-vehicle) and with infrastructure (vehicle-to-infrastructure). This data can be used to provide a more complete picture of vehicle status for identifying real-time lane change events and then help drivers to make better decisions or to implement vehicle control assist systems to avoid high risk lane change situations, thereby improving safety. Basic Safety Messages (BSMs) is the major exchanged data type. The core part of BSMs includes vehicle position (longitude, latitude), motion (speed, heading, and acceleration) and control (brake, turn signal). This study presents a new approach to identify aggressive lane change behaviors by using BSMs generated in real world by vehicles equipped with data acquisition systems (DAS) devices that participated in the Safety Pilot Model Deployment deployed in Ann Arbor Michigan. A total of 2,160,912 samples generated from 246 trips by 51 vehicles are used for analysis. The proposed approach has successfully identified lane change behaviors using a sub-sample (652,071) generated from 51 trips and the results have been successfully validated by using Google Earth.
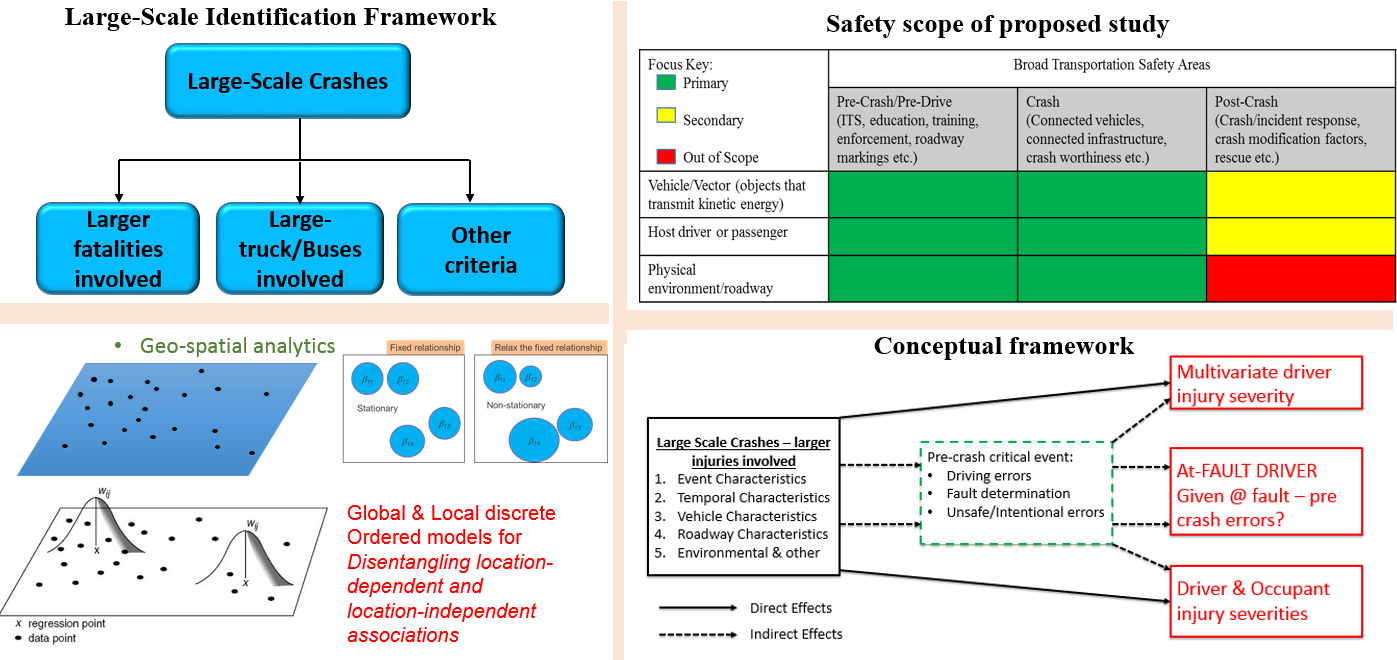
Crash Samples
While analysis of the overall crash samples (based on overall crash and injury distribution) is important, it is also imperative to rigorously analyze the tail of injury distributions (large-scale events), given the huge monetary impact of such crash events on society, and to identify covariates and potential countermeasures. This project’s objectives aim to address the following questions:
- What are the factors that can have direct effects on injury outcomes of large-scale crashes (either in terms of injury involved or truck/bus involvement)?
- What factors contribute significantly to injury outcomes of large-scale crashes via a mediating effect through pre-crash critical behavioral errors? (both from temporal and geographically diverse perspective), and
- Given that a driver is observed to be “at-fault”, which type of behavioral errors (intentional/unintentional) constitute the event specific taxonomies of errors?
- What implications do these taxonomies of errors of “at-fault” drivers have on injury outcomes of other “Not-At-Fault” crash involved vehicles (drivers/passengers).
The research team will utilize rigorous analytical and econometric tools such as path analysis, geographically weighted count data regressions, and time-series models to address aforementioned objectives. Ultimately, the detailed proposed framework is expected to provide fruitful guidelines for policy making and educational and enforcement programs, and thus likely helping the nation in achieving the challenging “zero-fatality” national goal.
Alternative Fuel Vehicles (AFVs)
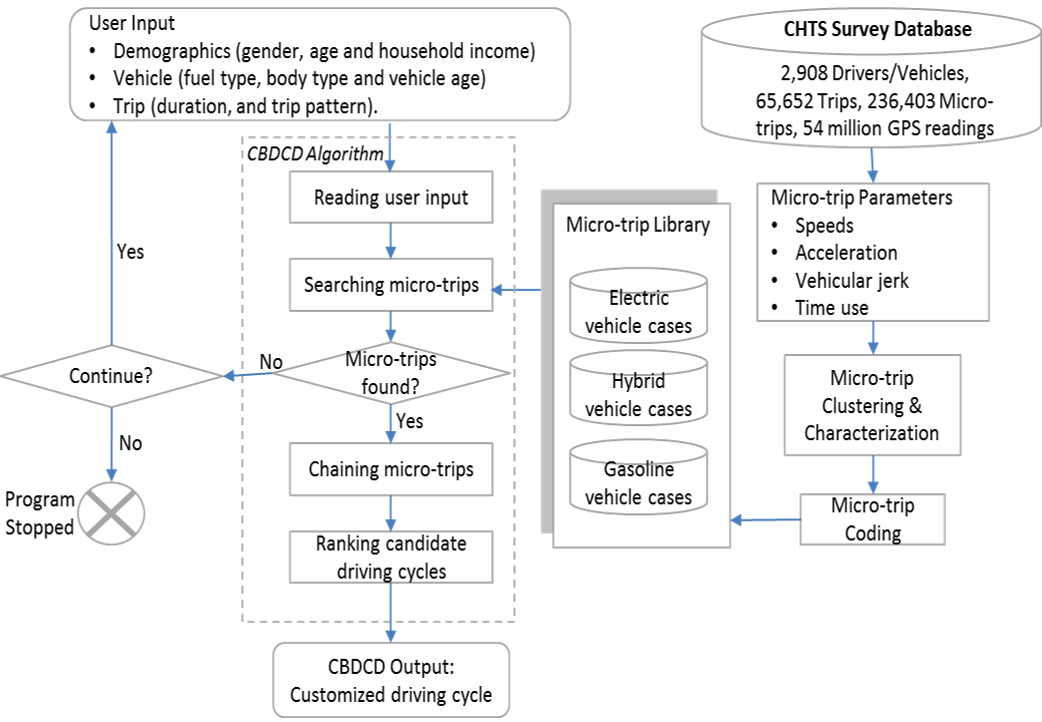
Wider deployment of alternative fuel vehicles (AFVs) can help with increasing energy security and transitioning to clean vehicles. Ideally, adopters of AFVs are able to maintain the same level of mobility as users of conventional vehicles while reducing energy use and emissions. Greater knowledge of AFV benefits can support consumers’ vehicle purchase and use choices. The Environmental Protection Agency’s fuel economy ratings are a key source of potential benefits of using AFVs. However, the ratings are based on pre-designed and fixed driving cycles applied in laboratory conditions, neglecting the attributes of drivers and vehicle types. While the EPA ratings using pre-designed and fixed driving cycles may be unbiased they are not necessarily precise, owning to large variations in real-life driving. Thus, to better predict fuel economy for individual consumers targeting specific types of vehicles, it is important to find driving cycles that can better represent consumers’ real-world driving practices instead of using pre-designed standard driving cycles.
In this project, a methodology for customizing driving cycles to provide convincing fuel economy predictions that are based on drivers’ characteristics and contemporary real-world driving has been developed. The methodology takes into account current micro-driving practices in terms of maintaining speed, acceleration, braking, idling, etc., on trips. Specifically, using a large-scale driving data collected by in-vehicle Global Positioning System as part of a travel survey, a micro-trips (building block) library for California drivers is created using 54 million seconds of vehicle trajectories on more than 60,000 trips, made by 3,000 drivers. To generate customized driving cycles, a new tool, known as Case Based System for Driving Cycle Design, is developed. The AFV driving cycles, created from real-world driving data, show significant differences from conventional driving cycles currently in use. This further highlights the need to enhance current fuel economy estimations by using customized driving cycles, helping consumers make a more informed vehicle purchase and use decisions.
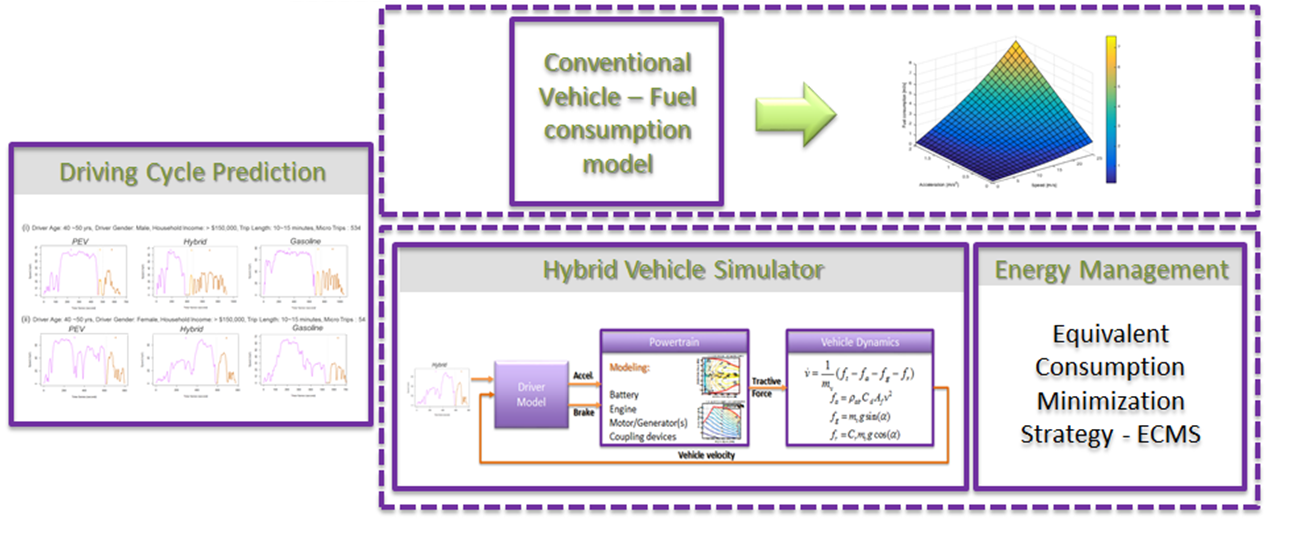
Fuel Consumption
It has been shown that due to variations in real-life driving, pre-designed standard driving cycles are not precise to obtain accurate fuel consumption estimations for individual customers using specific types of vehicles (Liu et al. 2016). In this project, the objective is a comparative analysis of the fuel consumption for three different vehicles models is performed, by using customized driving profiles based on real driving data along and pre-designed standard driving cycles. The characteristics of the standard driving profiles are compared to the customized driving profiles. Then, three fuel consumption estimation models are used to compare the fuel consumption for the standard and the customized driving profiles.
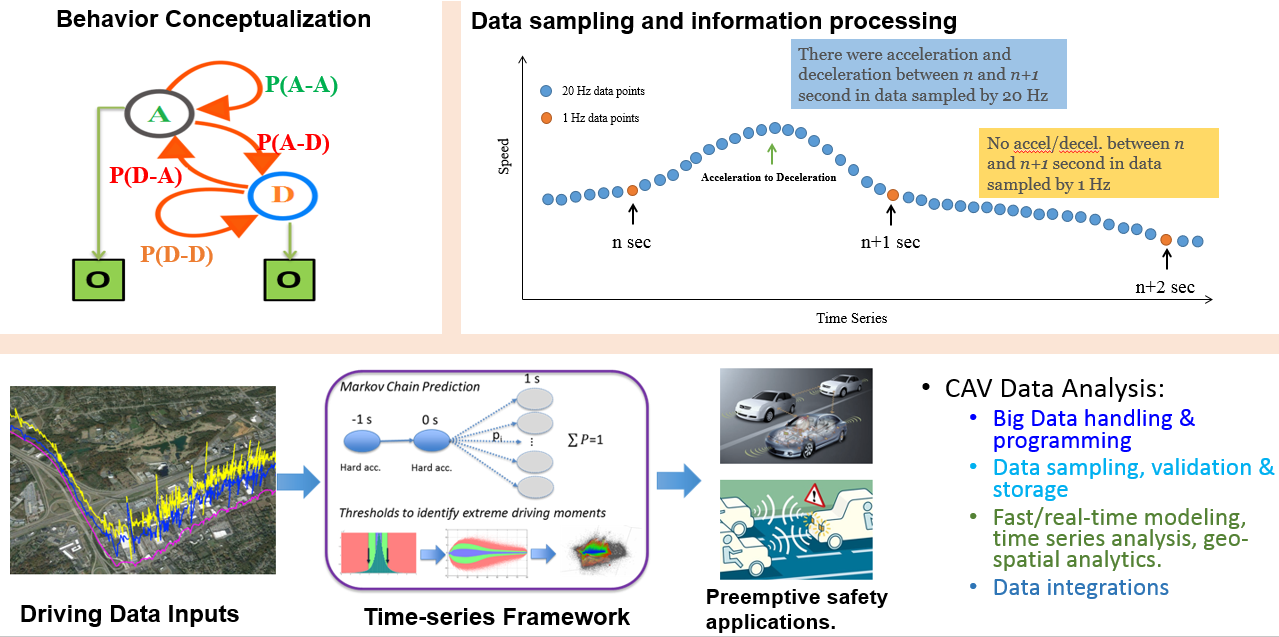
Safety Pilot Model Deployment (SPMD)
The Safety Pilot Model Deployment (SPMD) underway in Ann Arbor, Michigan, is intended to demonstrate vehicle-to-vehicle (V2V) and vehicle-to-infrastructure (V2I) technologies in a real-world environment. This study attempts to utilize Basic Safety Messages (frequency of 10 Hz) through Data Acquisition Systems (967, 270 samples from 154 unique trips undertaken by 48 vehicles) to understand the process that governs the time at which driving behavior transitions between different regimes/states i.e. longitudinal acceleration and deceleration, jerky movements. Recognizing the time-series driving behavior profiles that are believed to transition over finite set of unobserved regimes/states (acceleration/deceleration), a dynamic Markov-switching regression framework will be developed for understanding the persistency and volatility of two different states in driving behaviors. The proposed framework will allow the evolution of specific driving regimes separately and to conceptualize factors that may be associated with regime(s) evolution. The analysis is expected to reveal several factors or situations that may be differently associated with the following:
- Driver’s tendency to stay in same state, and
- Conditions in which they switch between different driving states (i.e. acceleration and deceleration.)
From a safety perspective in connected vehicle environment, such information can help us understand the specific situations (e.g. factors related to host vehicle’s motion, vehicle component status, and instantaneous driving contexts) that may be associated with drivers’ tendency to behave differently, thus helping us in development of preemptive warnings/alert and control assist applications.
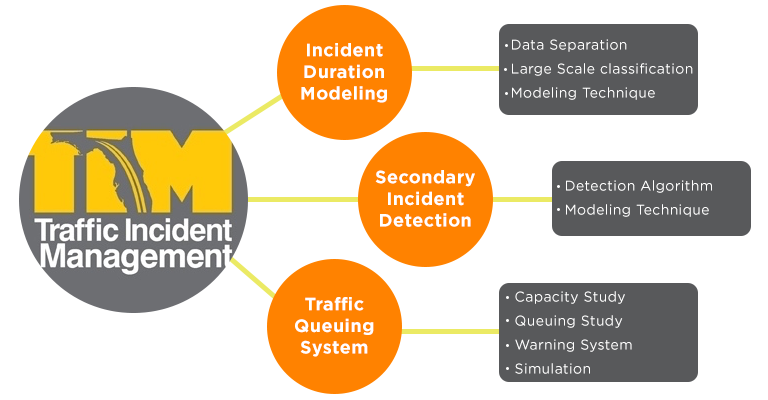
Traffic Incidents
Traffic incidents always post a threat to the traffic flow along the freeway by introducing negative impacts to the overall freeway transportation system, such as congestion, reduced safety level, increased energy consumption and fuel, increased greenhouse gas emissions and drivers’ increasing anxiety, etc. In this study, we are trying to find out the associated or causal factors that will induce the occurrence of the traffic incidents by using several regional incident data, and other incident related databases. Specifically, one objective of our study is to develop a model for the incident duration through applying several duration prediction approaches. Another objective of this study is to develop algorithms and models to detect the secondary incidents that can occur as a consequence. By studying the independent and dependent variables in the database, we further analyze the operational defects of the procedures of regional traffic incident management teams. Also, simulation analysis is applied to warn the traffic incident site if a queue is formed during the incident in order to further reduce the possibility of secondary incident occurrence. Through this study, we expect to be able to provide more useful information to traffic incident managers to further improve current operations, mobility, safety, energy use and environment.